The annual DC benchmarking data for 2023 was third-party verified, improving the accuracy of the data. All of DC’s historically-disclosed data is available for review, so AOBA and the Hub reviewed data from 2019 to 2023 to identify trends. The good news: we’re seeing more buildings improve performance to above the median BEPS thresholds year by year. Figure 3, below, shows the general improvement trend. After 2020, multifamily buildings have generally outpaced offices in terms of meeting BEPS thresholds by year on the order of 2-3% pre year on average. In total, this shows a 10% improvement in multifamily properties meeting BEPS thresholds and a 15% improvement in office properties meeting BEPS thresholds. This also tracks with 2023 data, which shows about 70% of offices meeting the BEPS threshold and 68% of multifamily buildings meeting the BEPS threshold.
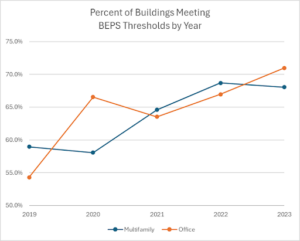
Figure 3: Percentage of multifamily and office buildings whose ENERGY STAR score is at or above the BEPS median thresholds year by year.
In reviewing the 2019 ENERGY STAR score data listed in current benchmarking datasets, we found that overall the 2019 scores for offices and multifamily spaces were higher than one might expect. Recall that half of all buildings 50,000 SF and above must take action to meet BEPS. In practice, we’re now seeing over half of buildings with 2019 scores that are higher than the median BEPS threshold, including close to 60% of multifamily properties’ 2019 data. This is a big, positive change on average, but it begs a question: why is this happening? While we don’t know the specific reasons for each building’s score change, we can hypothesize a couple of reasons that might result in changes in 2019 data:
- Changes in aggregate meter data provided by a utility such as Pepco or Washington Gas retroactively applied to certain buildings.
- Changes in building data as a result of data corrections from updated benchmarking or third-party verification efforts that changed the 2019 scores including revised gross floor area or occupancy rates. DOEE reviews all corrections to past data submitted.
We also want to caution that, in practice, changes in aggregate meter data or building data as a result of third-party verification do not always result in better energy performance. Some building ENERGY STAR scores improved while others decreased. It does, however, appear that more building ENERGY STAR scores increased than decreased. The way to conclusively understand why would be to examine older data sets—that is, data sets from before those changes in building data inputs happened.
Since it appears that more buildings are increasing their ENERGY STAR scores each year, we would also expect to see an increase in ENERGY STAR medians. Recall that the median is defined as the midpoint—50% of buildings are below the median and 50% of buildings are above the median. This means that if over 50% of buildings of a particular type increase their scores to at or above the BEPS Period 1 median, the new median might be above the BEPS Period 1 median. Since 65% of offices and 67% of multifamily buildings are at or above the BEPS medians today and we see a year-over-year improvement in building energy performance, we expect to see a year-over-year increase in the Washington, DC ENERGY STAR medians. We see this in Figure 4.
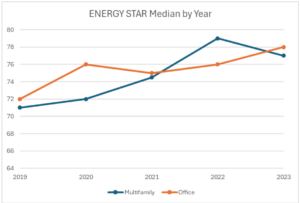
Figure 4: ENERGY STAR medians by year for offices and multifamily buildings, 2019-2023.
While we see somewhat inconsistent year-to-year performance in the medians, across the 2019 to 2023 sample size, we do see an overall increase in the ENERGY STAR median scores over this time.
Notes on the data
Data used in this analysis was pulled from DC’s Energy Benchmarking OpenData website on February 24, 2025. Buildings were filtered based on:
- If the reporting year of the data was 2019, 2020, 2021, 2022, or 2023.
- The EPA calculated primary property type, including only offices and multifamily properties.
- If they were listed as “In Compliance” with DOEE, which indicates DOEE has accepted the benchmarking submission.
- If the property has an ENERGY STAR score, which filters out properties unable to obtain an ENERGY STAR score for whatever reason.
- If the reported building gross floor area of the property was over 50,000 square feet, indicating the property would be subject to the current BEPS. (Tax record square footage data was considered but not used, as benchmarking submissions and corrections that impacted gross floor area would propagate as changes in reported building gross floor area.)