Created in partnership with
![]()
Introduction
The median ENERGY STAR scores for privately owned offices and multifamily properties over 50,000 square feet have increased since 2019 as discussed in AOBA and the Hub’s 2025 benchmarking data series reviewing 2023 data. The median is defined as the midpoint—50% of buildings are below the median and 50% of buildings are above the median. If the median is increasing it means that building performance in the District is generally improving over time.
To see if this trend is continuing, we reviewed the latest benchmarking data from 2024. Tracking year-over-year changes in median ENERGY STAR score also allows for some projection and advance planning as we move closer to DC BEPS Cycle 2 which is scheduled to start on January 1, 2028. The standards for DC BEPS Cycle 2 will be set based on benchmarking data from calendar year 2026. Buildings that are below median performance will be considered not in compliance and will need to take action in Cycle 2. The process is the same as BEPS Cycle 1, but for the first time, the size threshold will be lower to include buildings over 25,000 square feet.
To better understand trends across property types, this piece will look at ENERGY STAR median changes since 2019 for offices, multifamily buildings, hotels, and worship facilities. As of today, we don’t know if DC BEPS Cycle 2 will have different BEPS based on building size. To account for this, our analysis looks at benchmarking data two different ways:
- Tracking medians for these property types for all buildings over 25,000 square feet
- Tracking medians for these property types for buildings over 50,000 square feet separately from tracking medians of these property types for buildings 25,000 – 49,999 square feet.
ENERGY STAR Medians for buildings over 25,000 square feet
The graph below represents ENERGY STAR medians for offices, multifamily buildings, hotels, and worship facilities over 25,000 square feet from 2019 to 2024. Since buildings under 50,000 square feet were not required to disclose energy use to the District until 2021 and the data was not publicly disclosed before 2022, the medians from 2019 to 2021 are based on buildings over 50,000 square feet while medians from 2022 to 2024 include buildings over 25,000 square feet.
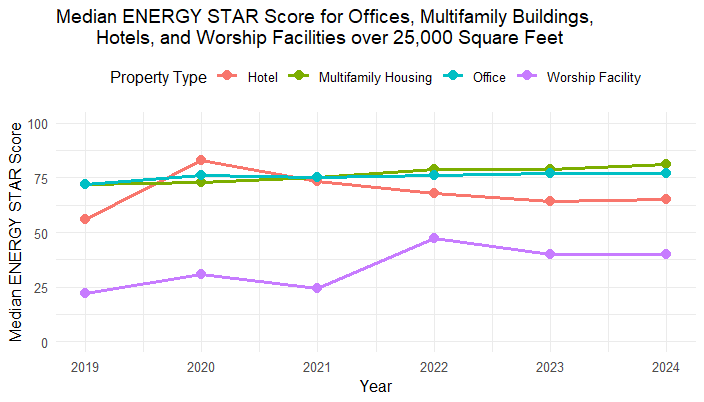
Figure 1: 2024 ENERGY STAR ratings for offices, multifamily, hotel, and worship facilities over 25,000 sq. ft. in Washington, DC, based on data obtained on February 5, 2026.
For multifamily buildings (673 buildings), the ENERGY STAR median was 72 in 2019, increasing to an ENERGY STAR score of 81 in 2024. Compared to the multifamily building standard of 66 which was set for BEPS Cycle 1, the 2019 median identified in our analysis is higher at 72, likely due to changes in retroactive aggregate meter data or benchmarking data corrections from third-party verification such as revised gross floor area, as discussed in last year’s piece. We see this phenomenon in other building types as well.
For offices (493 buildings), the ENERGY STAR median was 72 in 2019, and has risen to 77 in 2024. As a reminder, the BEPS for offices in Cycle 1 is an ENERGY STAR score of 71. For both multifamily and office, we see a relatively linear trend in ENERGY STAR score improvement from 2019 to 2024.
For hotels (106 buildings), the median was 56 in 2019, rose sharply to above 80 in 2020, before decreasing to its current ENERGY STAR score 65 in 2024, which still represents a substantial increase in ENERGY STAR median compared to 2019; it is also an improvement over the BEPS for hotels in Cycle 1 of 54. The sharp increase in ENERGY STAR score in 2020 is likely a result of a decrease in hotel occupancy due to COVID-19.
For worship facilities (15 buildings), the ENERGY STAR median was 22 in 2019, and in 2024 was 40. Worship facilities’ BEPS for Cycle 1 is an ENERGY STAR score of 17. Similar to other building types, there is a significant increase in the median in 2020 (again, possibly due to COVID-19); more surprising is a second increase in 2022 before the most recent decrease from 2023-2024. Unlike other building types in this series, a significant majority of worship facilities are under 50,000 square feet, so this decrease in ENERGY STAR median may be due to changes from third-party verification.
As a general trend, all four of these building typologies have experienced an increase in ENERGY STAR median values from 2019 to 2024. Since the BEPS is required to be set based on no less than the ENERGY STAR median of each property type, this would appear to imply that the BEPS for Cycle 2 could be higher than the BEPS for Cycle 1. However, the specific BEPS will not be known until DOEE sets the standard in 2028. Information on possible next steps is in the Conclusions section.
What is also unknown: if the BEPS threshold set for Cycle 2 will be different for buildings over 50,000 square feet and buildings 25,000 to 49,999 square feet. DOEE may be incorporating small building considerations for future BEPS cycles based on findings from the Small Building Retuning Pilot Program administered by Baumann Consulting with the Hub and IPL as project partners under a DOEE grant.
ENERGY STAR Medians for buildings over 50,000 square feet and between 25,000-49,999 square feet
As a next step in this analysis we looked separately at buildings over 50,000 square feet and buildings 25,000 to 49,999 square feet. As might be expected, based on the graph in the previous section, building types above 50,000 square feet analyzed in this series (1,291 buildings) all saw an increase in ENERGY STAR medians from 2019 to 2024. Please see the graph below for these medians.
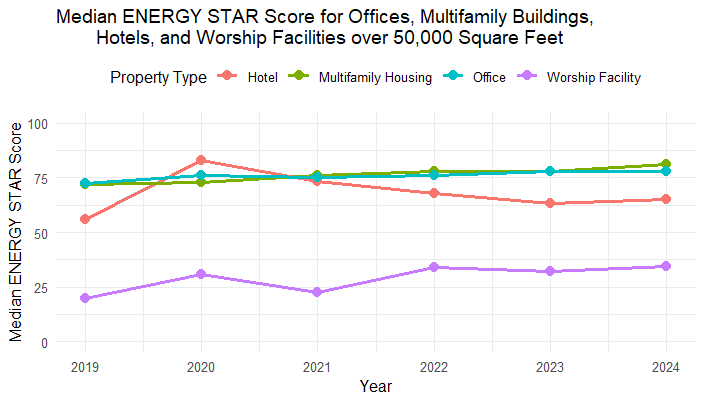
Figure 2: 2024 ENERGY STAR ratings for offices, multifamily, hotel, and worship facilities over 50,000 sq. ft. in Washington, DC, based on data obtained on February 5, 2026.
Most notably, the medians for multifamily buildings in this series are very similar for buildings over 50,000 square feet and buildings over 25,000 square feet. Other building typologies see differences in medians across building size thresholds, although potentially for different reasons. For example, most worship facilities are under 50,000 square feet and most hotels are over 50,000 square feet, which means worship facility medians over 50,000 square feet and hotel medians under 50,000 square feet are derived from a small number of buildings. Office medians may be due to difference in space characteristics, which will be investigated more later in this series.
Next, we looked at buildings between 25,000-49,999 square feet (492 buildings). Since these buildings’ public energy disclosures did not occur until 2022, the data reviewed is between 2022 and 2024.
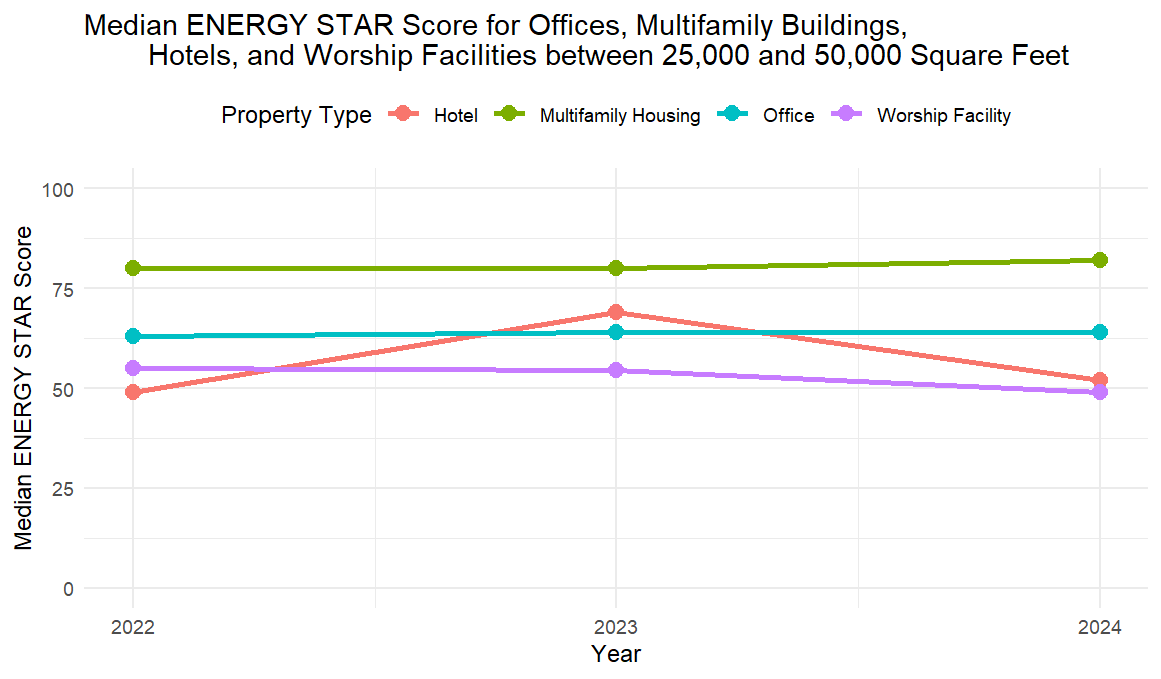
Figure 3: 2024 ENERGY STAR ratings for offices, multifamily, hotel, and worship facilities 25,000-50,000 sq. ft. in Washington, DC, based on data obtained on February 5, 2026.
For multifamily buildings (378 in total), the median did not change much, with a slight increase from 80 in 2022 to 81 in 2024, which matches the median seen in multifamily buildings over 50,000 square feet.
For offices (67 buildings), the ENERGY STAR median also stayed about the same, rising from 63 in 2022 to 64 in 2024. This is notably below the median for offices over 50,000 square feet. For worship facilities (45 buildings), the median has dropped slightly from 55 in 2022 to 49 in 2024 which is notably higher than worship facilities over 50,000 square feet. Hotel medians vary significantly year-over-year, but in practice only a few hotels are between 25,000 and 50,000 square feet so fluctuations are largely due to the small quantity of buildings.
While the multifamily medians for buildings under 50,000 square feet is generally similar to the multifamily median for buildings over 50,000 square feet, the other building typologies under 50,000 square feet show notably different medians compared to their larger building cohorts.
Conclusions
As seen in the data, medians for these building typologies have increased since 2019. As a result, this means BEPS Cycle 2 is likely to be set based on higher ENERGY STAR scores than BEPS Cycle 1. While this analysis looks at all buildings and does not differentiate between those that need to take action to meet this BEPS from those that were already in compliance, analysis that DOEE conducted on the 2024 benchmarking data set implies this increase in median ENERGY STAR scores is due to buildings taking action to meet BEPS. (See Table 3 in the linked post for details.) This could mean that with the 2025 and 2026 data disclosures we may see small differences in median ENERGY STAR score between buildings over 50,000 square feet and buildings 25,000 to 49,999 square feet although 2024 data shows similar medians for both building size categories.
As a result, this represents a meaningful call to action for buildings over 50,00 square feet:
- Buildings that met the BEPS for Cycle 1: If you have or manage a building that had an ENERGY STAR score above the BEPS Cycle 1 standard and did not enter the compliance cycle, check your latest score against the 2024 median for your property type. If your score is below the 2024 median, now is a great time to start thinking about proactive compliance precursors like conducting an energy audit or retro-commissioning. Actions taken in the near term could help reduce the lift required to meet BEPS Cycle 2 if your property enters the compliance cycle, or even raise your ENERGY STAR score up enough in 2026 that your property might meet BEPS Cycle 2.
- Buildings that did not meet the BEPS for Cycle 1: If you have or manage a building that needed to take action to meet BEPS Cycle 1 and are in the process of meeting BEPS Cycle 1 requirements, but still have an ENERGY STAR score below the 2024 median for your property type, continue planning for additional measures that will reduce your energy usage over time into BEPS Cycle 2. If you have an existing energy audit, consider additional measures that were not previously implemented. If you do not have an energy audit, consider obtaining one now to start planning for BEPS Cycle 2, and incorporate energy efficiency measures into your capital planning over the next few years.
For buildings between 25,000 and 49,999 square feet: this also represents a good time to start thinking about BEPS Cycle 2. The first step is to figure out if your most recent benchmarking data has an ENERGY STAR score above or below the median. If your building’s ENERGY STAR score is below the median, then it may make sense to start planning for an energy audit and implementing energy efficiency measures into your capital planning over the next few years.
Please note: this is an independent analysis and we will not know what the actual BEPS Cycle 2 standards are until they are set by DOEE in 2028.