Introduction
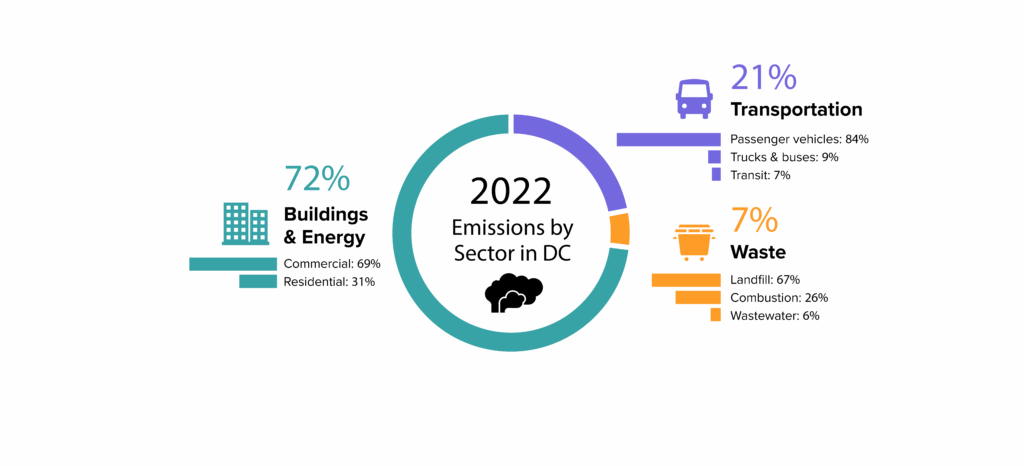
In the District of Columbia, buildings are the single largest contributor (over 70%) to citywide greenhouse gas (GHG) emissions. Greenhouse gases, which include a wide range of gases, trap heat in the atmosphere, increasing the average temperature and causing climate change. Therefore, achieving the sustainability, energy, and climate goals of the District requires a heavy focus on how the building stock is performing. As part of the Clean Energy DC Act of 2018, the District adopted Building Energy Performance Standards (BEPS), which set minimum levels of energy performance for large, existing buildings. BEPS, in concert with codes for new construction, will help reduce GHG emissions in the District’s large buildings, which in turn will help the District progress towards meeting its goals of reducing emissions by 60% by 2030 and becoming carbon neutral by 2045 (note that these goals were updated by the Climate Commitment Act of 2022).
Just the facts please
To better understand GHG emissions and how buildings and their operations contribute to those emissions, this resource will explain:
- How emissions are characterized
- How much GHG emissions are associated with a building in the District
- Ways to measure and target lower emissions for your building
In general, building GHG emissions are lower when the building’s energy use is lower, but a building with lower energy use could still produce significant GHG emissions if, for example, there is a lot of on-site combustion. Building owners need to do their part to understand the impacts of their decisions not only for compliance with District policies in the near term, but also the long-term impacts of emissions on the climate, economy, and society.
How Are Building Emissions Characterized?
The Greenhouse Gas Protocol, an organization that provides a standard framework and tools for measuring emissions, defines emissions as either direct or indirect.
- Direct GHG emissions are from sources that are owned or controlled by the reporting entity.
- Indirect GHG emissions are a consequence of the activities of the reporting entity but occur at sources owned or controlled by another entity.
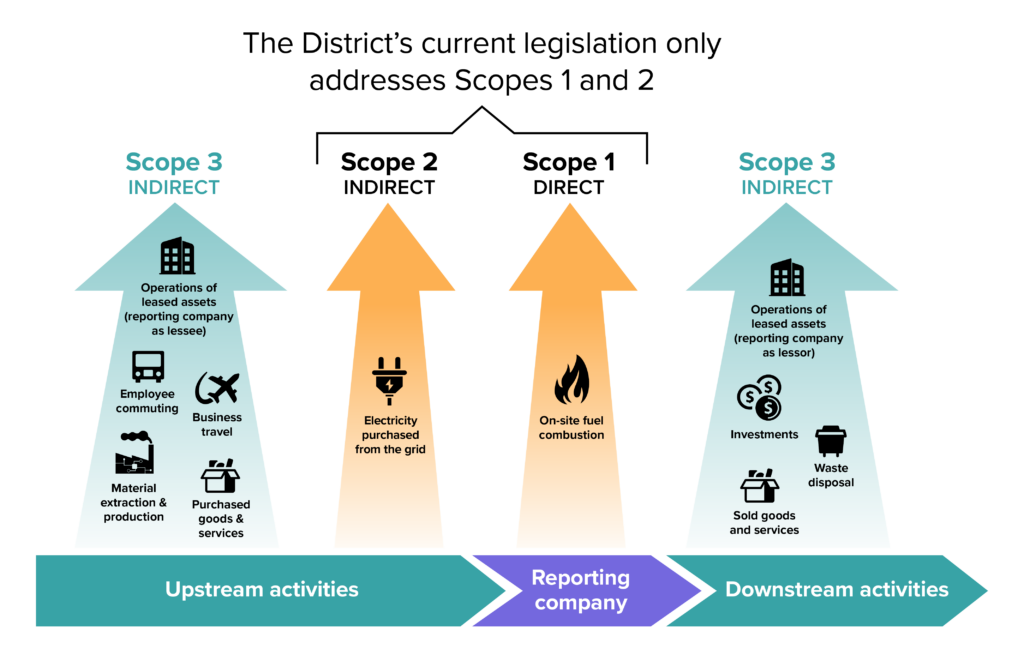
Additionally, GHG emissions are typically characterized by their “scope” or category. There are three scopes: 1, 2, and 3.
| Scope | Emissions Type | Common Building Uses in This Scope |
| Scope 1 | Direct GHG emissions | On-site fuel combustion (e.g. gas used on site for cooking, water heating, and/or space heating) and refrigerant leaks |
| Scope 2 | Indirect GHG emissions | Emissions from purchased electricity from the grid (i.e. usage on an electricity bill) and other centralized energy sources (e.g. steam) |
| Scope 3 | Other indirect GHG emissions | Material extraction and production, waste disposal, commuting and travel, water consumption and disposal, and many others |
Figure 1: Outline of scope 1, 2, and 3 emissions. Source: World Resources Institute & World Business Council for Sustainable Development.
Ongoing building energy consumption, and what the District is addressing in its green building and climate goals, generally falls within Scopes 1 and 2. However, with improvement in building performance over time and the development of new, highly efficient systems, Scope 3 emissions, especially those focused on the embodied carbon emissions of products, building materials, and construction processes, are becoming a higher priority for the building industry to address.
Calculating Building Emissions
GHG emissions are not directly measured in buildings through a meter in the same way water and electricity are. Rather, emissions are estimated based on how much electricity, gas, and other fuels a building consumes.
Scope 1 Emissions
Gas combustion in the building, which can occur in a boiler, furnace, or in cooking appliances, emits GHGs directly at the site (Scope 1 emissions) as a byproduct of combustion.
In the majority of cases, calculating Scope 1 emissions can be as simple as looking at gas consumption values on utility bills. Inputting this information into ENERGY STAR® Portfolio Manager, the platform required by the District for large buildings to report their annual benchmarking data, will automatically create an output to see a building’s GHG emissions.
Building owners have the greatest level of control over their Scope 1 emissions. To reduce Scope 1 emissions, owners can and should plan to change out gas-burning equipment like water heaters, furnaces, space heaters, and ovens and cooktops with their electric counterparts at end of life.
Scope 2 Emissions
For grid-level electricity consumption (Scope 2 emissions), calculating emissions is more complicated. Because electricity comes indirectly from multiple generating sources, such as natural gas, biomass, and solar, the associated GHG emissions from electricity consumption vary substantially depending on the building’s location, the time of day, and the time of year. The emissions intensity of grid-delivered electricity is changing, however, due to increased deployment of renewable energy and natural gas, and the decline of coal-fired power plants in the region (see U.S. Energy Information Administration FAQs for details). In particular, the District has a plan in place to reach 100% renewable energy generation by the year 2032.
You can approximate your building’s Scope 2 emissions using Portfolio Manager. Once you enter building-specific data, the output includes information about a building’s estimated total GHG emissions and total GHG emissions intensity (the amount of emissions generated per square foot). The platform pulls in grid information for the region, which is how it estimates a building’s Scope 2 emissions. This is a useful tool to track energy use and emissions trends over time.
The emissions outputs generated by Portfolio Manager should be used as a starting point to understand Scope 2 emissions, but other tools provide higher levels of accuracy and allow your company to set meaningful goals for emissions reduction. Two industry-standard resources are the GHG Protocol’s Corporate Accounting and Reporting Standard, which provides businesses guidance on GHG emissions inventory, and Scope 2 Guidance which can assist in setting corporate standards.
Building owners are not in control of grid emissions, but can curb their Scope 2 emissions by reducing their overall electric consumption through efficiency upgrades, installing on-site renewable energy, or purchasing off-site green power via Power Purchase Agreements or Renewable Energy Credits (RECs).
Scope 3 Emissions
Scope 3 emissions, those that come from an organization’s supply chain and business operations, often represent an organization’s largest source of total GHG emissions (see EPA’s Climate Leadership inventory guidance for details). Scope 3 emissions include the embodied carbon that is present throughout the building’s entire lifecycle, spanning from material extraction and processing to building construction, maintenance, and renovation, to the end-of-life stage in which the building is deconstructed or demolished, and disposed of.
When most companies report on their GHG emissions, they are often only required to include information about Scopes 1 and 2, and the District’s legislation only addresses those scopes as well. However, as the effects of climate change are exacerbated, organizations are beginning to look at their Scope 3 emissions as well to understand the full impact of their operations. Building owners can factor in Scope 3 emissions by using available tools to make informed choices for material selection or by conducting a whole-building lifecycle assessment.
Architecture 2030 provides a suite of resources and networks to help reduce emissions from the embodied carbon of construction materials.
Setting GHG Emissions Targets
Given that buildings are responsible for 71% of emissions in the District, setting a target to explicitly measure and track Scopes 1 and 2 emissions is necessary to meaningfully address the climate crisis. Taking action to reduce energy consumption and emissions in buildings today paves the way for a 100% clean energy future and begins to address the unsustainable emissions associated with the District’s buildings.
There are several options to set a target for your building’s greenhouse gas impact. Reducing your building’s emissions over time is primarily a matter of combining energy efficiency upgrades and electrification of all appliances and systems. You can set emissions targets as:
- Total emissions limit (lbs CO2/sq. ft. per year)
- Energy reduction targets over time (e.g. percent better each year)
- Switching to high-efficiency electric appliances (e.g. heat pump water heaters) to reduce Scope 1 and Scope 2 emissions
- Set a Science-Based Target that aligns GHG emissions reduction targets with what the latest climate scientists say is necessary to meet the goals of the Paris Agreement.
With a clear goal in place and a timeframe in which to reach your goal, tracking progress toward goals is critical. Reducing your energy consumption not only saves GHG emissions, but also reduces energy costs, improves air quality, and creates job opportunities for renewable energy installations and energy efficiency projects.
Key Takeaways
- Emissions are characterized in various ways and occur throughout the whole life of a building.
- Emissions come not only from energy use, but also from material manufacture, transportation, building construction, renovations, refrigerants, and a building’s end-of-life stage.
- Regulations achieve emissions savings in part by reducing energy consumption in buildings.
- Setting targets for energy consumption in existing buildings leads to fewer emissions.
- Consider materials with low embodied carbon when renovating or expanding existing buildings.